import highlight_text as ht
from plotnine import aes, geom_point, ggplot, labs, theme_matplotlib, theme_set
from plotnine.data import mpg
theme_set(theme_matplotlib())
p = (
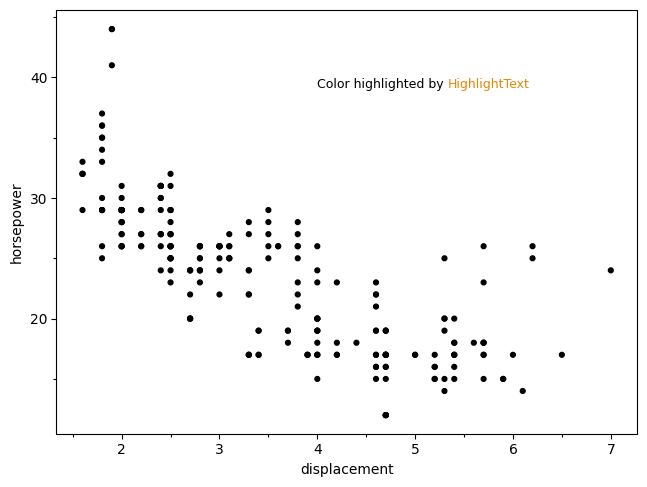
ggplot(mpg, aes(x="displ", y="hwy"))
+ geom_point()
+ labs(x="displacement", y="horsepower")
)
fig = p.draw()
ax = fig.axes[0] # or via fig.get_axes()[0]
ht_ax_text = 'Color highlighted by <HighlightText::{"color": "#E58606"}>'
ht.ax_text(4, 40, ht_ax_text, vsep=3, fontsize=9, va="top", ax=ax)
figThis is a short post documenting my experience trying to retrieve the Axes from plotnine.
The idea was inspired by this code and this video I came across, but the original solution didn’t quite work for me. Fortunately, I found that we can access the list of Axes directly using either fig.axes or fig.get_axes().
In the example below, I adapt a snippet from the plotnine documentation to demonstrate how to highlight text in color using HighlightText.
WarningDisclaimer
This post was drafted by me, with AI assistance to refine the content.