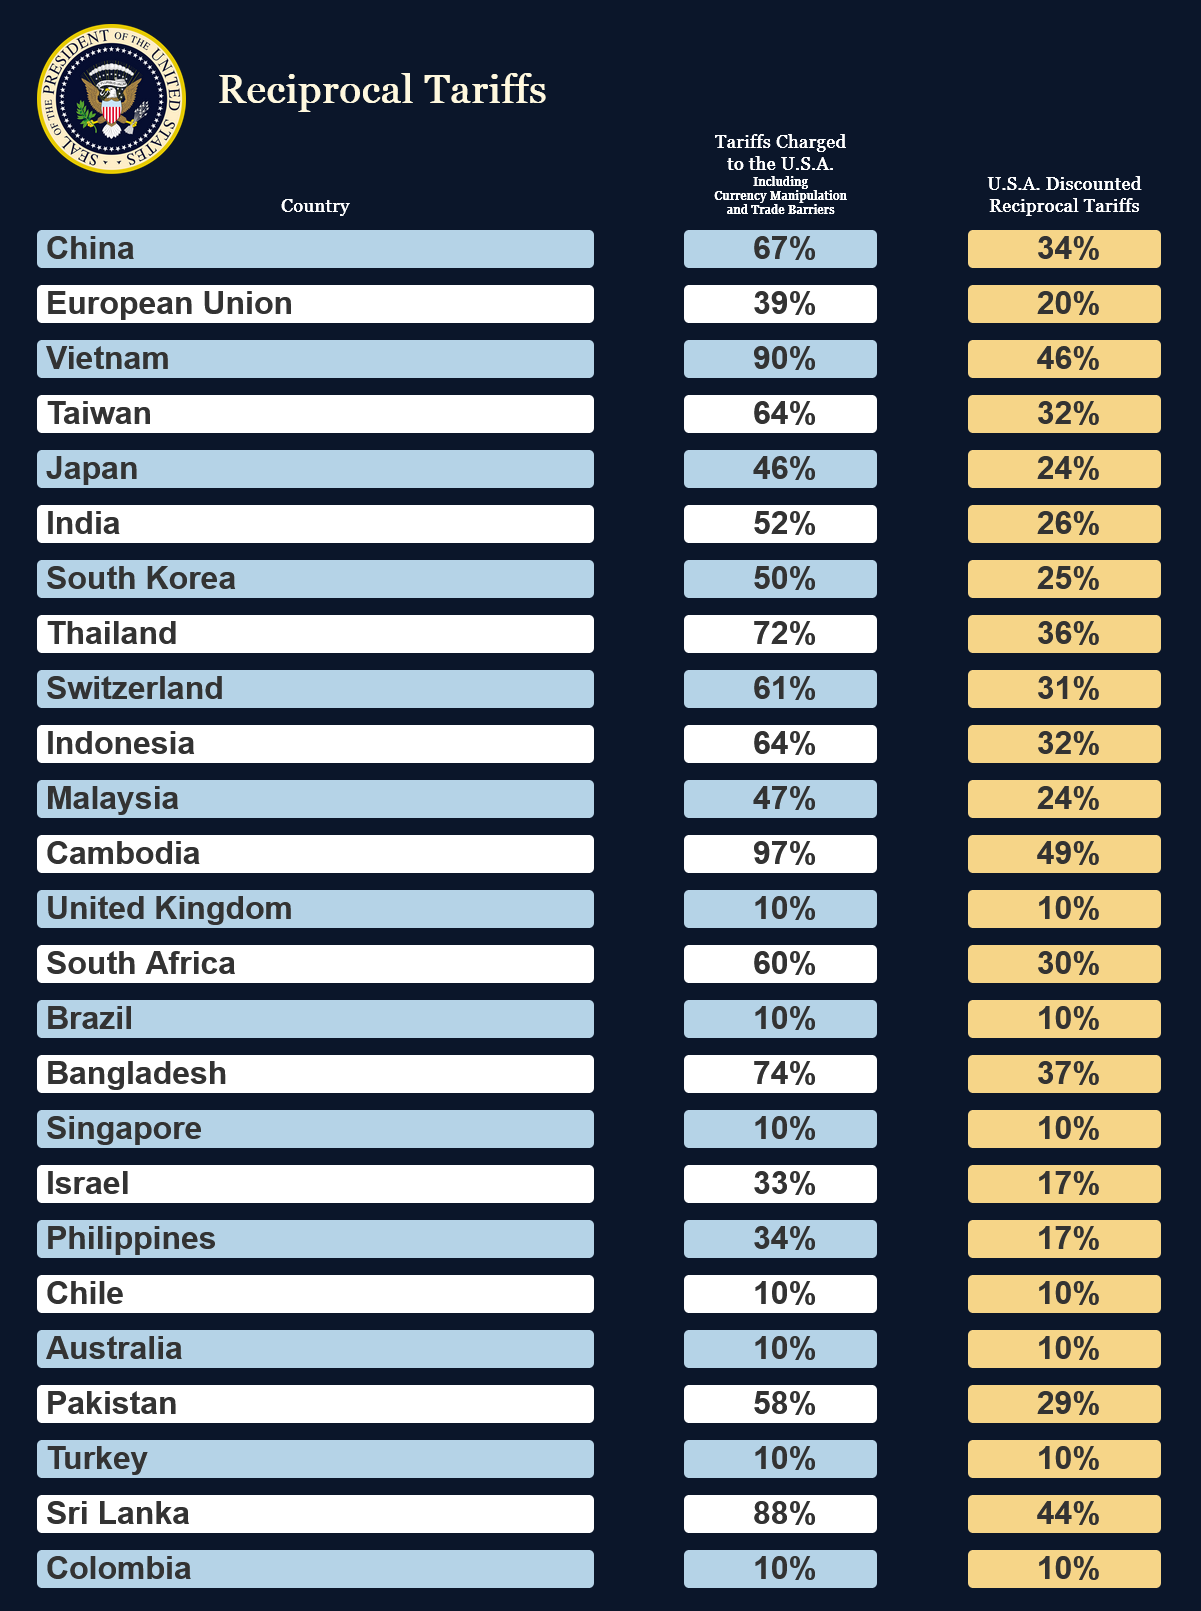
import polars as pl
from great_tables import GT, google_font, html, loc, style, vals
# source1: https://truthsocial.com/@realDonaldTrump/114270398531479278
# source2:
# "https://upload.wikimedia.org/wikipedia/commons/
# thumb/3/36/Seal_of_the_President_of_the_United_States.svg/
# 800px-Seal_of_the_President_of_the_United_States.svg.png"
logo = vals.fmt_image("logo.png", height=150)[0]
data = {
"country": [
"China",
"European Union",
"Vietnam",
"Taiwan",
"Japan",
"India",
"South Korea",
"Thailand",
"Switzerland",
"Indonesia",
"Malaysia",
"Cambodia",
"United Kingdom",
"South Africa",
"Brazil",
"Bangladesh",
"Singapore",
"Israel",
"Philippines",
"Chile",
"Australia",
"Pakistan",
"Turkey",
"Sri Lanka",
"Colombia",
],
"tariffs_charged": [
"67%",
"39%",
"90%",
"64%",
"46%",
"52%",
"50%",
"72%",
"61%",
"64%",
"47%",
"97%",
"10%",
"60%",
"10%",
"74%",
"10%",
"33%",
"34%",
"10%",
"10%",
"58%",
"10%",
"88%",
"10%",
],
"reciprocal_tariffs": [
"34%",
"20%",
"46%",
"32%",
"24%",
"26%",
"25%",
"36%",
"31%",
"32%",
"24%",
"49%",
"10%",
"30%",
"10%",
"37%",
"10%",
"17%",
"17%",
"10%",
"10%",
"29%",
"10%",
"44%",
"10%",
],
}
dark_navy_blue = "#0B162A" # background
light_blue = "#B5D3E7" # row
white = "#FFFFFF" # row
yellow = "#F6D588" # "reciprocal_tariffs" column
gold = "#FFF8DE" # logo
def change_border_radius(
x: str, border_radius: str, background_color1: str, background_color2: str
) -> str:
return f"""\
<div style="background-color: {background_color1};border: None">\
<div style="border-radius: {border_radius};\
background-color:{background_color2};">\
{x}\
</div>\
</div>\
"""
def change_border_radius_expr(
cols: pl.Expr,
return_dtype: pl.DataType,
border_radius: str,
background_color1: str,
background_color2: str,
) -> pl.Expr:
return cols.map_elements(
lambda x: change_border_radius(
x, border_radius, background_color1, background_color2
),
return_dtype=return_dtype,
)
df = (
pl.DataFrame(data)
.with_row_index("mod")
.with_columns(pl.col("mod").mod(2), *[pl.lit("").alias(str(i)) for i in range(4)])
.with_columns(
# "country" and "tariffs_charged" columns
pl.when(pl.col("mod").eq(0))
.then(
change_border_radius_expr(
pl.col("country", "tariffs_charged"),
pl.String,
"5px",
dark_navy_blue,
light_blue,
)
)
.otherwise(
change_border_radius_expr(
pl.col("country", "tariffs_charged"),
pl.String,
"5px",
dark_navy_blue,
white,
)
),
# "reciprocal_tariffs" column
change_border_radius_expr(
pl.col("reciprocal_tariffs"), pl.String, "5px", dark_navy_blue, yellow
),
)
.select(["0", "country", "1", "tariffs_charged", "2", "reciprocal_tariffs", "3"])
# add a row at the end of the table
.pipe(
lambda df_: pl.concat(
[df_, pl.DataFrame({col: "" for col in df_.columns})], how="vertical"
)
)
)
# inner_ring_style, inner_ring_width, inner_ring_color = "dashed", "3px", "orange"
(
GT(df)
.cols_align(
"center", columns=["tariffs_charged", "reciprocal_tariffs"]
)
.cols_label(
{
"country": html(
f"""\
<br>\
<div>\
{logo} \
<span style="color: {gold}; font-size: 40px;">\
  Reciprocal Tariffs\
</span>\
</div>\
<br>\
<b>Country</b>\
"""
),
"tariffs_charged": html(
"""\
<b>Tariffs Charged<br>to the U.S.A.</b>\
<br>\
<span style="font-size: 12px;">\
Including<br>Currency Manipulation<br>and Trade Barriers\
</span>\
"""
),
"reciprocal_tariffs": html(
"<b>U.S.A. Discounted<br>Reciprocal Tariffs</b>"
),
"0": "",
"1": "",
"2": "",
"3": "",
}
)
.cols_width(
{
"country": "50%",
"0": "3%",
"1": "7%",
"2": "7%",
"3": "3%",
"tariffs_charged": "18%",
"reciprocal_tariffs": "18%",
}
)
# For labels and body:
# set the background color of the labels and body to `dark_navy_blue`
.tab_style(
style=style.fill(color=dark_navy_blue),
locations=[loc.column_labels(), loc.body()],
)
# For body:
# set the border color of the body to `dark_navy_blue`
# set the weight and size
.tab_style(
style=[
style.borders(sides="all", color=dark_navy_blue),
style.text(weight="bold", size="xx-large"),
],
locations=loc.body(),
)
# For labels:
# set the font, weight, size and color
# center-align the labels
.tab_style(
style=[
style.text(
font=google_font(name="Georgia"),
weight="bold",
size="large",
color=white,
),
style.css("text-align: center;"),
],
locations=loc.column_labels(),
)
# hide the bottom line of the label section
.tab_options(column_labels_border_bottom_style="hidden")
# set the body background color to `dark_navy_blue` for the last row
.tab_style(
style=style.fill(color=dark_navy_blue),
locations=loc.body(rows=[-1]),
)
# .opt_table_outline(
# style=inner_ring_style,
# width=inner_ring_width,
# color=inner_ring_color,
# )
# need to adjust `window_size` to obtain a higher-quality figure
# .save("reciprocal_tariffs_gt.png", web_driver="firefox", window_size=(1200, 1000))
)
