This post demonstrates that Polars, Great Tables, and marimo can successfully run within a Quarto environment (as shown in this post). The example uses a table styler selector from Great Tables—and I’m honestly surprised it works!
marimo
NoteGive It a Sec – WASM Magic Happening
The widgets may take a few moments to load, as they rely on WebAssembly under the hood.
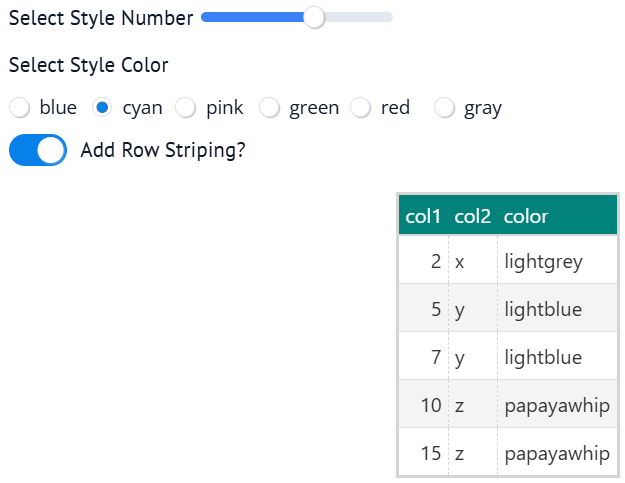
| col1 | col2 | color |
|---|---|---|
| 2 | x | lightgrey |
| 5 | y | lightblue |
| 7 | y | lightblue |
| 10 | z | papayawhip |
| 15 | z | papayawhip |
Check out the full marimo code below or view it on molab.
import marimo

__generated_with = "0.13.15"
app = marimo.App(width="medium")


@app.cell
def _():
    import marimo as mo
    import polars as pl
    from great_tables import GT, loc, style

    return GT, mo, pl


@app.cell
def _(pl):
    data = {
        "col1": [2, 5, 7, 10, 15],
        "col2": ["x", "y", "y", "z", "z"],
        "color": ["lightgrey", "lightblue", "lightblue", "papayawhip", "papayawhip"],
    }
    df = pl.DataFrame(data)
    return (df,)


@app.cell
def _(mo):
    style_widget = mo.ui.slider(1, 6, label="Select Style Number")
    mo.output.append(style_widget)

    _colors = ["blue", "cyan", "pink", "green", "red", "gray"]
    color_widget = mo.ui.radio(
        options=_colors, value=_colors[0], label="Select Style Color"
    )
    mo.output.append(color_widget)

    row_striping_widget = mo.ui.switch(value=True, label="Add Row Striping?")
    mo.output.append(row_striping_widget)
    return color_widget, row_striping_widget, style_widget


@app.cell
def _(GT, color_widget, df, row_striping_widget, style_widget):
    GT(df).opt_stylize(
        style=style_widget.value,
        color=color_widget.value,
        add_row_striping=row_striping_widget.value,
    )
    return


if __name__ == "__main__":
    app.run()
WarningDisclaimer
This post was drafted by me, with AI assistance to refine the content.