import pandas as pd
import polars as pl
from great_tables import GT, from_column, loc, style
from polars import selectors as cs

data = {
    "col1": [2, 5, 7, 10, 15],
    "col2": ["x", "y", "y", "z", "z"],
    "color": ["lightgrey", "lightblue", "lightblue", "papayawhip", "papayawhip"],
}

color_mapping = {"x": "lightgrey", "y": "lightblue", "z": "papayawhip"}This post provides a concise guide on styling the table body with custom colors using Pandas and Polars.
There are two primary methods for applying a color palette: one leverages a pre-existing column containing color values, while the other determines colors dynamically based on conditions. I’ll walk you through both approaches.
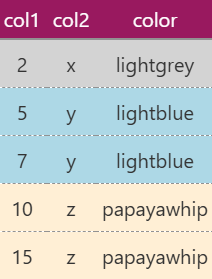
Since all the generated tables will have the same appearance, I’ll display the final result just once:
Preparations
We’ll start by creating a data dictionary, which will be used with Pandas or Polars later. Additionally, we’ll define a color_mapping dictionary to store the palette information for styling.
Pandas
First, we create a Pandas DataFrame called df_pd using data as the input:
Code
df_pd = pd.DataFrame(data)
print(df_pd)
col1 col2 color
0 2 x lightgrey
1 5 y lightblue
2 7 y lightblue
3 10 z papayawhip
4 15 z papayawhipUsing an Existing Column
In this straightforward scenario, the DataFrame already contains a predefined column with color names for each row. You can use the from_column() function provided by Great Tables to apply colors to the table body:
(
    GT(df_pd)
    .tab_style(style=style.fill(color=from_column("color")), locations=loc.body())
    .cols_align(align="center")
    .opt_stylize(style=3, color="pink")
)
Using Functions
In cases where colors need to be determined dynamically based on conditions, the pd.Series.case_when() function can be very useful. The following example categorizes the values of the col1 column into three different colors:
def color_selector(df_):
    return df_["col1"].case_when(
        [
            (df_["col1"].lt(3), "lightgrey"),  # <3
            (df_["col1"].lt(10), "lightblue"),  # <10
            (df_["col1"].ge(10), "papayawhip"),  # >=10
        ]
    )


(
    GT(df_pd)
    .tab_style(style=style.fill(color=color_selector), locations=loc.body())
    .cols_align(align="center")
    .opt_stylize(style=3, color="pink")
)
For categorical-like columns (e.g., col2), a simple value-to-color mapping may be sufficient. In such cases, a predefined dictionary can be used with pd.Series.map() or pd.Series.replace():
(
    GT(df_pd)
    .tab_style(
        style=style.fill(color=lambda df_: df_["col2"].map(color_mapping)),
        locations=loc.body(),
    )
    .cols_align(align="center")
    .opt_stylize(style=3, color="pink")
)
(
GT(df_pd)
.tab_style(
style=style.fill(color=lambda df_: df_["col2"].replace(color_mapping)),
locations=loc.body(),
)
.cols_align(align="center")
.opt_stylize(style=3, color="pink")
)Alternatively, if you prefer sticking with the same approach, pd.Series.case_when() still works:
def color_selector(df_):
    return df_["col2"].case_when(
        [
            (df_["col2"].eq("x"), "lightgrey"),
            (df_["col2"].eq("y"), "lightblue"),
            (df_["col2"].eq("z"), "papayawhip"),
        ]
    )


(
    GT(df_pd)
    .tab_style(style=style.fill(color=color_selector), locations=loc.body())
    .cols_align(align="center")
    .opt_stylize(style=3, color="pink")
)
Polars
Just like before, let’s start by creating a Polars DataFrame named df_pl using data as input:
Code
df_pl= pl.DataFrame(data)
print(df_pl)
shape: (5, 3)
┌──────┬──────┬────────────┐
│ col1 ┆ col2 ┆ color │
│ --- ┆ --- ┆ --- │
│ i64 ┆ str ┆ str │
╞══════╪══════╪════════════╡
│ 2 ┆ x ┆ lightgrey │
│ 5 ┆ y ┆ lightblue │
│ 7 ┆ y ┆ lightblue │
│ 10 ┆ z ┆ papayawhip │
│ 15 ┆ z ┆ papayawhip │
└──────┴──────┴────────────┘Using an Existing Column
If the DataFrame already contains a column specifying colors, we can apply them directly with from_column():
(
    GT(df_pl)
    .tab_style(style=style.fill(color=from_column("color")), locations=loc.body())
    .cols_align(align="center")
    .opt_stylize(style=3, color="pink")
)
As another option, we can reference the color column using a Polars expression:
(
    GT(df_pl)
    .tab_style(style=style.fill(color=pl.col("color")), locations=loc.body())
    .cols_align(align="center")
    .opt_stylize(style=3, color="pink")
)
Using Conditional Logic with Polars Expressions
For cases where colors need to be assigned dynamically, pl.when() provides a structured way to define conditions. The example below assigns colors based on the values in col1:
color_selector_expr = (
    pl.when(pl.col("col1").lt(3))  # <3
    .then(pl.lit("lightgrey"))
    .when(pl.col("col1").lt(10))  # <10
    .then(pl.lit("lightblue"))
    .when(pl.col("col1").ge(10))  # >=10
    .then(pl.lit("papayawhip"))
)

(
    GT(df_pl)
    .tab_style(style=style.fill(color=color_selector_expr), locations=loc.body())
    .cols_align(align="center")
    .opt_stylize(style=3, color="pink")
)
For categorical-like columns (e.g., col2), predefined mappings can be applied efficiently using pl.Expr.replace():
(
    GT(df_pl)
    .tab_style(
        style=style.fill(color=pl.col("col2").replace(color_mapping)),
        locations=loc.body(),
    )
    .cols_align(align="center")
    .opt_stylize(style=3, color="pink")
)
Alternatively, if you prefer the conditional approach, pl.when() can still be used:
color_selector_expr = (
    pl.when(pl.col("col2").eq(pl.lit("x")))
    .then(pl.lit("lightgrey"))
    .when(pl.col("col2").eq(pl.lit("y")))
    .then(pl.lit("lightblue"))
    .when(pl.col("col2").eq(pl.lit("z")))
    .then(pl.lit("papayawhip"))
)


(
    GT(df_pl)
    .tab_style(style=style.fill(color=color_selector_expr), locations=loc.body())
    .cols_align(align="center")
    .opt_stylize(style=3, color="pink")
)
Final Notes
In this post, we explored how to use a custom color palette to style table backgrounds with style.fill(). The same approach can be applied to customize text color using style.text() or adjust border color with style.borders().
Lastly, remember that loc.body() allows you to target specific columns and rows, giving you precise control over table styling.
WarningDisclaimer
This post was drafted by me, with AI assistance to refine the content.