import polars as pl
from great_tables import GT, loc, style
from great_tables.data import countrypops

import turtle_island as ti

df_pd = countrypops.sample(10).loc[:, ["country_name", "year", "population"]]
df_pl = pl.from_pandas(df_pd)
row_expr = ti.is_every_nth_row(3)

(
    GT(df_pl)
    .tab_style(style=style.fill("lightblue"), locations=loc.body(rows=row_expr))
    .tab_style(style=style.fill("papayawhip"), locations=loc.body(rows=~row_expr))
    .opt_stylize(style=3, color="pink")
)This weekend, I started building a Python package called Turtle Island, which collects some of my ideas for helper functions aimed at reducing boilerplate when writing Polars expressions.
Currently, Turtle Island offers the following nine utilities:
case_when()– A cleaner and more readable way to construct chained conditional logic in Polars.make_index()– Creates a virtual row index as a Polars expression, without materializing it as a column.bucketize_lit()– Assigns literal values to rows in a round-robin pattern based on their index.bucketize()– A more general version ofbucketize_lit()that cycles through multiple Polars expressions, enabling advanced use cases with dynamic column values.is_every_nth_row()– Identifies every n-th row using a modulo operation on the row index.move_cols_to_start()– Reorders selected columns to appear at the beginning of the DataFrame.move_cols_to_end()– Reorders selected columns to appear at the end of the DataFrame.make_hyperlink()– Generates HTML anchor (<a>) tags fromtextandurlcolumns for rendering clickable links.make_tooltip()– Creates HTML tooltips fromlabelandtooltipcolumns for hoverable text display.
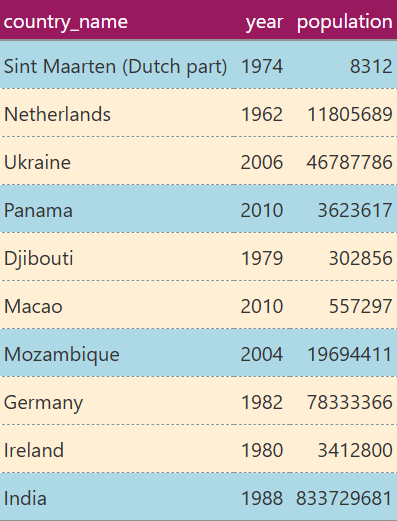
Here’s a quick example that uses ti.is_every_nth_row() to build a Polars expression suitable for styling tables interactively with Great Tables:
WarningDisclaimer
This post was drafted by me, with AI assistance to refine the content.