This is a follow-up to my previous post.
marimo
NoteGive It a Sec – WASM Magic Happening
The widgets may take a few moments to load, as they rely on WebAssembly under the hood.
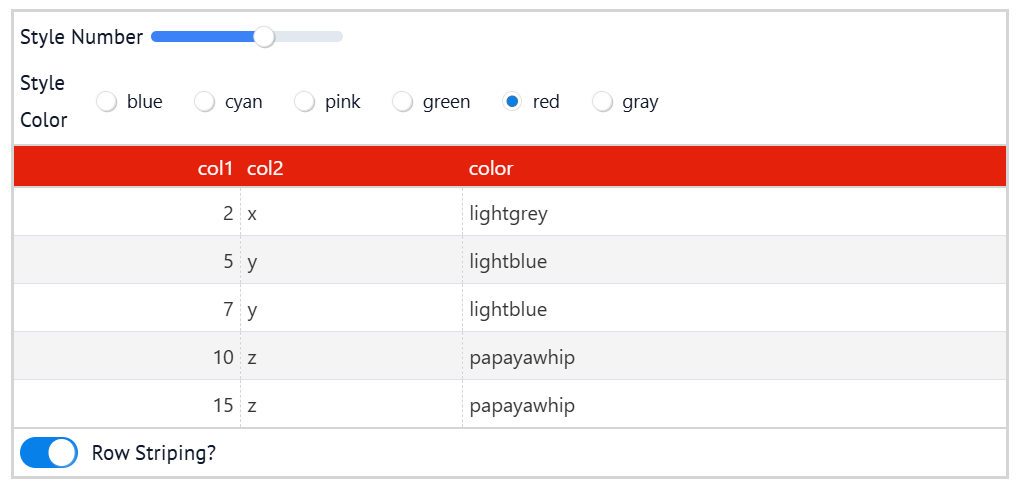
Here, I demonstrate how marimo widgets can be embedded in Great Tables by wrapping them with the html() function provided by the library. This allows interactive widgets to control the table’s appearance in a Quarto environment via WASM — a surprisingly powerful capability, in my opinion.
| col1 | col2 | color |
|---|---|---|
| 2 | x | lightgrey |
| 5 | y | lightblue |
| 7 | y | lightblue |
| 10 | z | papayawhip |
| 15 | z | papayawhip |
Check out the full marimo code below or view it on molab.
import marimo

__generated_with = "0.13.15"
app = marimo.App(width="medium")


@app.cell
def _():
    import marimo as mo
    import polars as pl
    from great_tables import GT, html

    return GT, html, mo, pl


@app.cell
def _(pl):
    data = {
        "col1": [2, 5, 7, 10, 15],
        "col2": ["x", "y", "y", "z", "z"],
        "color": [
            "lightgrey",
            "lightblue",
            "lightblue",
            "papayawhip",
            "papayawhip",
        ],
    }
    df = pl.DataFrame(data)
    return (df,)


@app.cell
def _(GT, df, html, mo):
    style_widget = mo.ui.slider(1, 6, label="Style Number")

    _colors = ["blue", "cyan", "pink", "green", "red", "gray"]
    color_widget = mo.ui.radio(
        options=_colors, value=_colors[0], label="Style Color", inline=True
    )

    row_striping_widget = mo.ui.switch(value=True, label="Row Striping?")

    gt = (
        GT(df)
        .tab_header(html(style_widget), html(color_widget))
        .tab_source_note(html(row_striping_widget))
        .opt_align_table_header("left")
    )
    return color_widget, gt, row_striping_widget, style_widget


@app.cell
def _(color_widget, gt, row_striping_widget, style_widget):
    gt.opt_stylize(
        style=style_widget.value,
        color=color_widget.value,
        add_row_striping=row_striping_widget.value,
    )
    return


if __name__ == "__main__":
    app.run()
WarningDisclaimer
This post was drafted by me, with AI assistance to refine the content.